Kaggle Tutorial
AlphaPy Running Time: Approximately 2 minutes
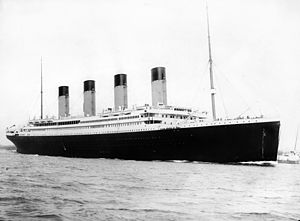
The most popular introductory project on Kaggle is Titanic, in which you apply machine learning to predict which passengers were most likely to survive the sinking of the famous ship. In this tutorial, we will run AlphaPy to train a model, generate predictions, and create a submission file so you can see where you land on the Kaggle leaderboard.
Note
AlphaPy is a good starter for most Kaggle competitions. We also use it for other competitions such as the crowd-sourced hedge fund Numerai.
Step 1: From the examples directory, change your directory:
cd Kaggle
Before running AlphaPy, let’s briefly review the model.yml
file in the config directory. We will submit the actual
predictions (1 vs. 0) instead of the probabilities, so
submit_probas is set to False. All features will be
included except for the PassengerId. The target variable
is Survived, the label we are trying to accurately predict.
We’ll compare random forests and XGBoost, run recursive
feature elimination and a grid search, and select the best
model. Note that a blended model of all the algorithms is
a candidate for best model. The details of each algorithm
are located in the algos.yml file.
project:
    directory         : .
    file_extension    : csv
    submission_file   : 'gender_submission'
    submit_probas     : False

data:
    drop              : ['PassengerId']
    features          : '*'
    sampling          :
        option        : False
        method        : under_random
        ratio         : 0.5
    sentinel          : -1
    separator         : ','
    shuffle           : False
    split             : 0.4
    target            : Survived
    target_value      : 1

model:
    algorithms        : ['RF', 'XGB']
    balance_classes   : True
    calibration       :
        option        : False
        type          : sigmoid
    cv_folds          : 3
    estimators        : 51
    feature_selection :
        option        : False
        percentage    : 50
        uni_grid      : [5, 10, 15, 20, 25]
        score_func    : f_classif
    grid_search       :
        option        : True
        iterations    : 50
        random        : True
        subsample     : False
        sampling_pct  : 0.2
    pvalue_level      : 0.01
    rfe               :
        option        : True
        step          : 3
    scoring_function  : roc_auc
    type              : classification

features:
    clustering        :
        option        : True
        increment     : 3
        maximum       : 30
        minimum       : 3
    counts            :
        option        : True
    encoding          :
        rounding      : 2
        type          : factorize
    factors           : []
    interactions      :
        option        : True
        poly_degree   : 5
        sampling_pct  : 10
    isomap            :
        option        : False
        components    : 2
        neighbors     : 5
    logtransform      :
        option        : False
    numpy             :
        option        : True
    pca               :
        option        : False
        increment     : 1
        maximum       : 10
        minimum       : 2
        whiten        : False
    scaling           :
        option        : True
        type          : standard
    scipy             :
        option        : False
    text              :
        ngrams        : 3
        vectorize     : False
    tsne              :
        option        : False
        components    : 2
        learning_rate : 1000.0
        perplexity    : 30.0
    variance          :
        option        : True
        threshold     : 0.1

pipeline:
    number_jobs       : -1
    seed              : 42
    verbosity         : 0

plots:
    calibration       : True
    confusion_matrix  : True
    importances       : True
    learning_curve    : True
    roc_curve         : True

xgboost:
    stopping_rounds   : 20
Step 2: Now, we are ready to run AlphaPy. Enter the following command:
alphapy
As alphapy runs, you will see the progress of the workflow,
and the logging output is saved in alphapy.log. When the
workflow completes, your project structure will look like this,
with a different datestamp:
Kaggle
├── alphapy.log
├── config
    ├── algos.yml
    ├── model.yml
└── data
└── input
    ├── test.csv
    ├── train.csv
└── model
    ├── feature_map_20170420.pkl
    ├── model_20170420.pkl
└── output
    ├── predictions_20170420.csv
    ├── probabilities_20170420.csv
    ├── rankings_20170420.csv
    ├── submission_20170420.csv
└── plots
    ├── calibration_train.png
    ├── confusion_train_RF.png
    ├── confusion_train_XGB.png
    ├── feature_importance_train_RF.png
    ├── feature_importance_train_XGB.png
    ├── learning_curve_train_RF.png
    ├── learning_curve_train_XGB.png
    ├── roc_curve_train.png
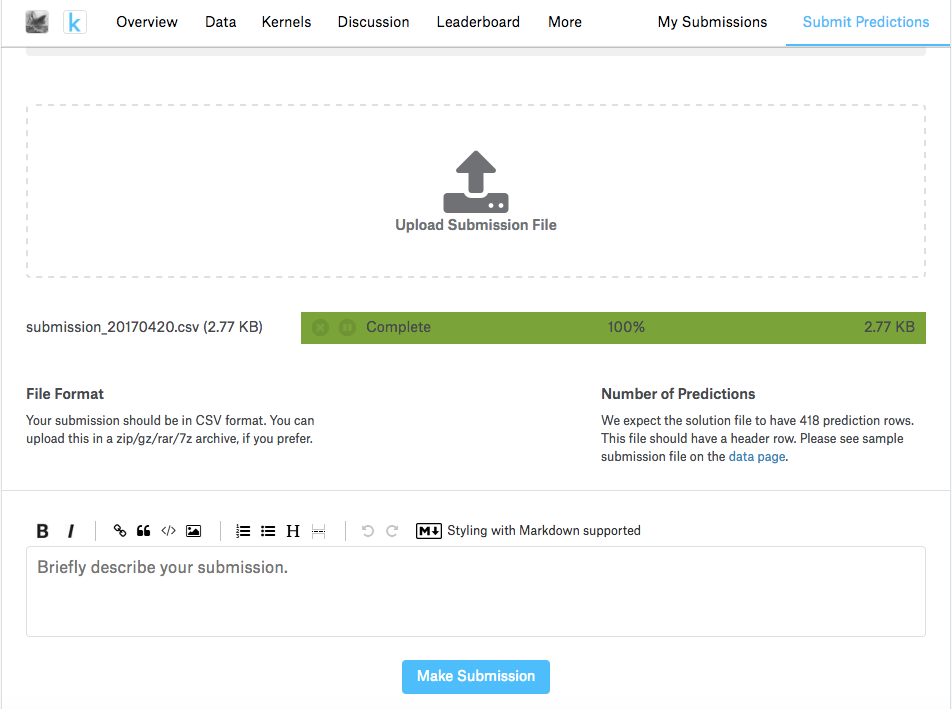
Step 3: To see how your model ranks on the Kaggle leaderboard,
upload the submission file from the output directory to the
Web site https://www.kaggle.com/c/titanic/submit.